Donate
2020 – 2022 · A story from our history In partnership with Google Health

The data the world needed. Built by volunteers.

When COVID-19 hit, the numbers governments needed were scattered across thousands of agencies. FinMango volunteers helped Google compile them into the world's largest open pandemic dataset: 22,000+ locations, 190+ countries, published in Nature, and used by the WHO, the World Bank and the IMF.

July 2020 – September 2022 · Open under CC BY · Nature Scientific Data, 2022
22K+
Locations tracked
190+
Countries covered
48
FinMango volunteers credited
2
Peer-reviewed papers
The story

How a financial-health nonprofit ended up in Nature.

Three chapters, from the first weeks of the pandemic to a permanent public record.

Chapter 01
Spring 2020
Everywhere, all at once

A world making decisions in the dark.

In the first months of the pandemic, the people making life-and-death decisions were working half blind. Case counts, hospital capacity, test results and policy changes were published by thousands of separate agencies, in different formats and languages, on web pages that changed without notice. No two countries, and often no two states, reported the same thing the same way.

At Google, a small team led by software engineer Oscar Wahltinez and technical program manager Aurora Cheung set out to fix that: one open repository, one consistent set of location keys, updated every day, free to anyone. The engineering could be automated. Finding, reading and verifying the sources could not. That needed people.

Chapter 02
Summer 2020
Akron, Ohio → the world

A five-year-old nonprofit says yes.

FinMango was a financial-health nonprofit, not a public-health institution. But it had what the project needed: a network of volunteers around the world willing to do careful, unglamorous work. In July 2020 the collaboration began.

Volunteers tracked down regional health-department feeds, read government bulletins, reconciled conflicting figures and hand-curated sources for places automated pipelines could not reach, from U.S. states to South Africa. They did it on top of school, jobs and family, through the worst months of the pandemic. Google's repository still credits FinMango for that manual curation, and for its research into how the pandemic was hitting local economies.

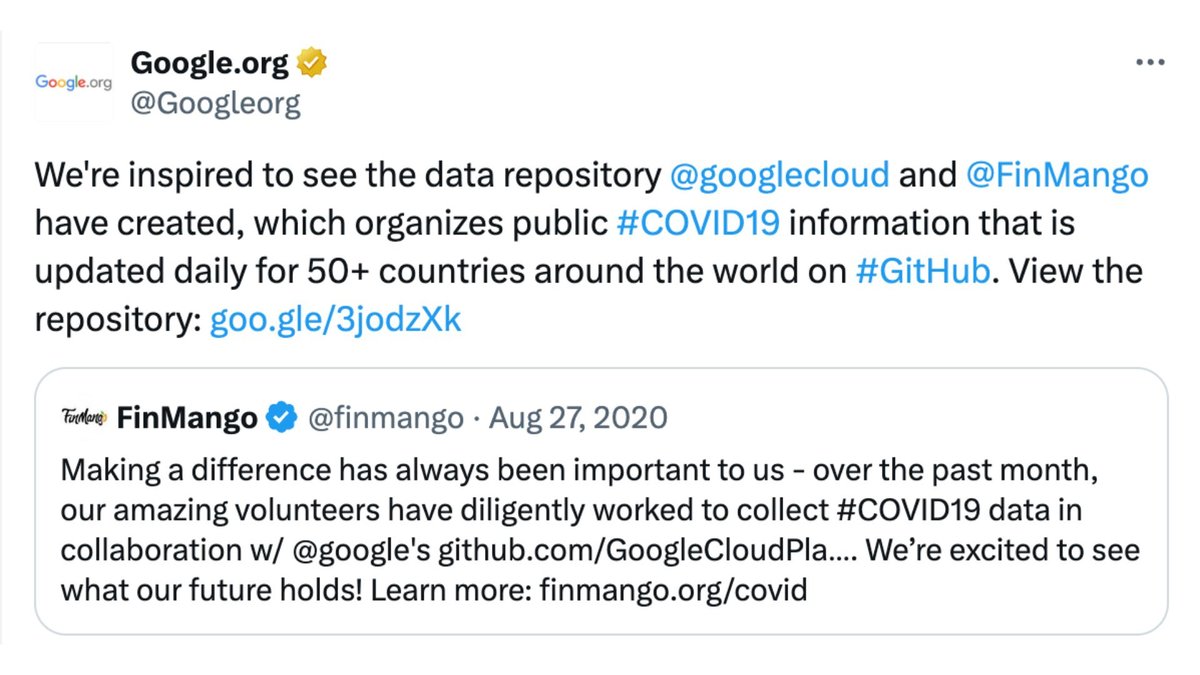
On August 27, 2020, Google.org told the world about the repository FinMango had helped build. That September, FinMango and Florida COVID Action compiled the most comprehensive dataset of COVID-19 in U.S. K-12 schools; an op-ed by Scott Glasgow and Oscar Wahltinez trended on U.S. News & World Report, and the work was picked up by The New York Times, CNN, Fortune, NBC and The Daily Beast.

Google.org tweet from August 27, 2020: We're inspired to see the data repository Google Cloud and FinMango have created, which organizes public COVID-19 information that is updated daily for 50+ countries around the world on GitHub.
Fig. 01 — Google.org, August 27, 2020. The repository then covered 50+ countries. It would grow to 190+.
Chapter 03
2021 – 2022
For the record

From a thank-you letter to a permanent public record.

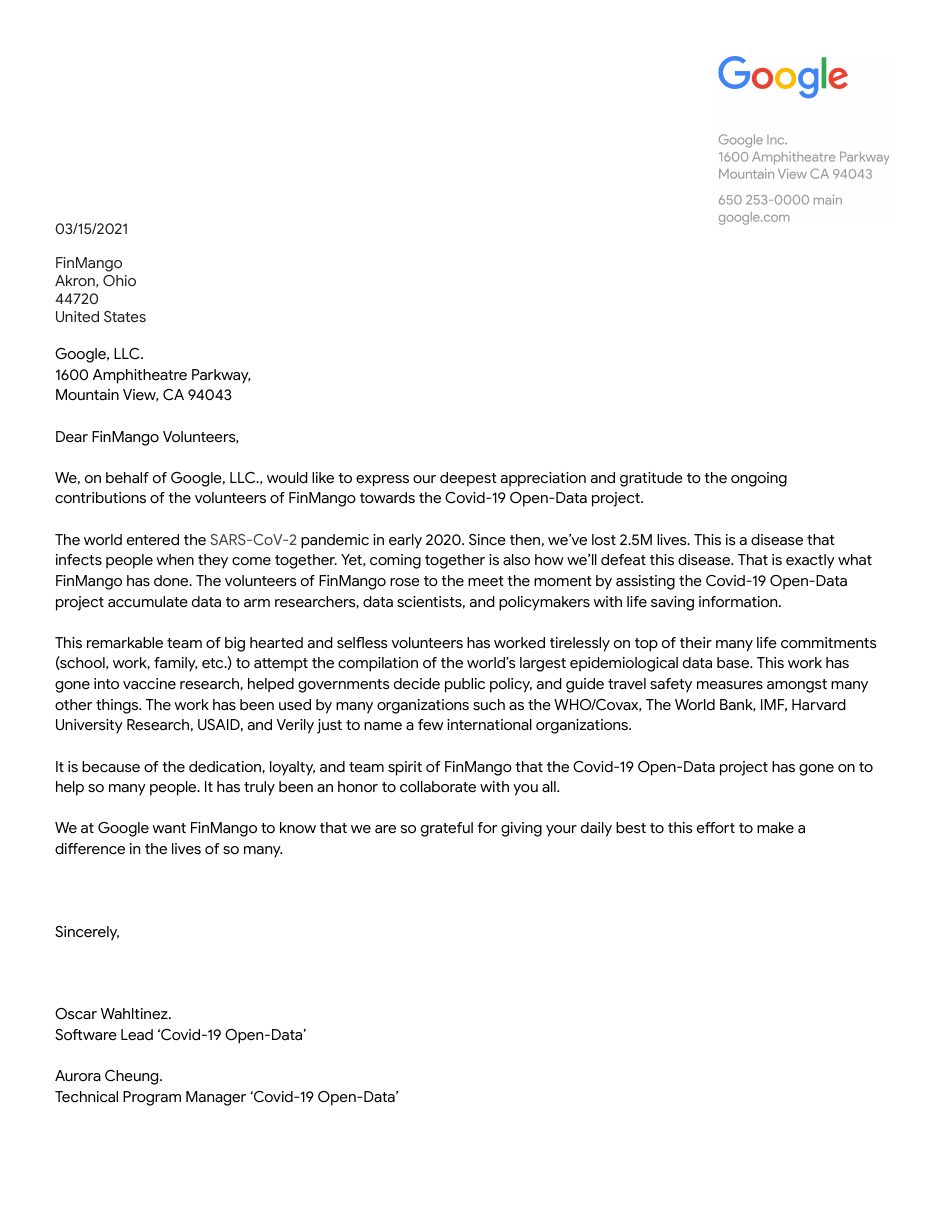
On March 15, 2021, Oscar and Aurora wrote to the volunteers on Google letterhead. By then the dataset was in use at the WHO and COVAX, the World Bank, the IMF, USAID, Harvard and Verily, and was feeding vaccine research, public policy and travel-safety decisions. That August, Google Health awarded FinMango a $50,000 grant for the collaboration.

In April 2022 the dataset was published in Nature Scientific Data as a global-scale, spatially granular meta-dataset. On September 15, 2022, with the emergency phase of the pandemic ending, real-time updates stopped and the repository became a permanent retrospective record, still open under a Creative Commons license. In 2023 the team published "The Mango Model" in the American Journal of Health Education, so the next crisis would have a blueprint. Oscar Wahltinez now serves on FinMango's Executive Board.

"This is a disease that infects people when they come together. Yet, coming together is also how we'll defeat this disease. That is exactly what FinMango has done."

Google, letter to FinMango volunteers, March 15, 2021
The record, line by line
  1. Jul 2020Collaboration with Google begins · volunteers start curating regional sources
  2. Aug 27, 2020Google.org spotlights the repositoryTweet ↗
  3. Sep 2020U.S. K-12 schools dataset · with Florida COVID Action; op-ed trends on U.S. NewsOp-ed ↗
  4. Mar 15, 2021Google writes to the volunteersRead it ↓
  5. Aug 2021$50,000 Google Health grant to FinMangoHistory
  6. Apr 2022Published in Nature Scientific DataPaper ↗
  7. Sep 15, 2022Real-time updates end · the repository becomes a retrospective archiveGitHub ↗
  8. 2023"The Mango Model" published · American Journal of Health EducationPaper ↗
March 15, 2021 · Mountain View, California

Google wrote to the volunteers.

Eight months into the collaboration, the two people running the project at Google put their thanks on paper. This is the letter, in full.

Scan of a one-page letter on Google letterhead, dated March 15, 2021, addressed to FinMango volunteers and signed by Oscar Wahltinez and Aurora Cheung
One page · Google letterheadOpen PDF ↗
To FinMango volunteers
Akron, Ohio
From Google, LLC.
1600 Amphitheatre Parkway, Mountain View

Dear FinMango Volunteers,

We, on behalf of Google, LLC., would like to express our deepest appreciation and gratitude to the ongoing contributions of the volunteers of FinMango towards the Covid-19 Open-Data project.

The world entered the SARS-CoV-2 pandemic in early 2020. Since then, we've lost 2.5M lives. This is a disease that infects people when they come together. Yet, coming together is also how we'll defeat this disease. That is exactly what FinMango has done. The volunteers of FinMango rose to the meet the moment by assisting the Covid-19 Open-Data project accumulate data to arm researchers, data scientists, and policymakers with life saving information.

This remarkable team of big hearted and selfless volunteers has worked tirelessly on top of their many life commitments (school, work, family, etc.) to attempt the compilation of the world's largest epidemiological data base. This work has gone into vaccine research, helped governments decide public policy, and guide travel safety measures amongst many other things. The work has been used by many organizations such as the WHO/Covax, The World Bank, IMF, Harvard University Research, USAID, and Verily just to name a few international organizations.

It is because of the dedication, loyalty, and team spirit of FinMango that the Covid-19 Open-Data project has gone on to help so many people. It has truly been an honor to collaborate with you all.

We at Google want FinMango to know that we are so grateful for giving your daily best to this effort to make a difference in the lives of so many.

Sincerely,

Oscar Wahltinez
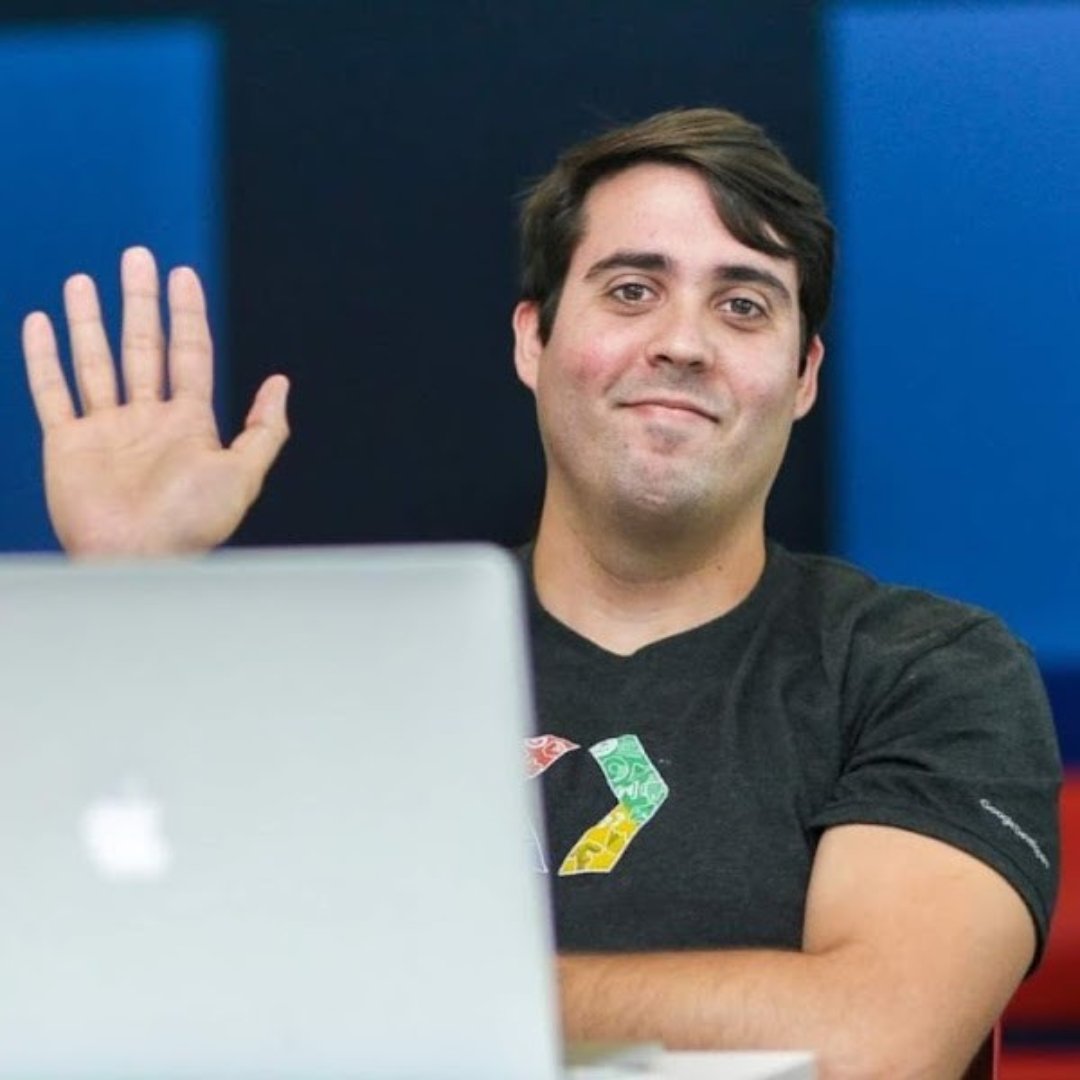
Oscar Wahltinez
Software Lead, Covid-19 Open-Data
Now on FinMango's Executive Board
Aurora Cheung
Technical Program Manager, Covid-19 Open-Data
Who relied on it

From vaccine labs to finance ministries.

WHO & COVAX
Global surveillance and the vaccine-sharing effort
The World Bank
Pandemic economics across member countries
IMF
Macroeconomic monitoring through the crisis
USAID
Development and emergency response programs
Harvard University
Academic epidemiology and policy research
Verily
Life-sciences research and testing programs
Governments
Public policy and travel-safety decisions
Researchers & journalists
Anyone, anywhere, for free

Organizations as named in Google's letter of March 15, 2021.

What's inside

One key, every location.

Every table shares the same location keys, so a researcher can join case counts to mobility, weather and policy for 22,000+ places with one line of code.

01

Epidemiology

Confirmed cases, deaths, recoveries and tests, updated several times a day while the project was live.

02

Hospitalizations

Patients admitted, in intensive care and on ventilators, where health systems reported it.

03

Vaccinations

People vaccinated and doses administered by vaccine, plus access and search-trend tables from Google.

04

Mobility

Movement trends from Google's Community Mobility Reports: workplaces, transit, retail, homes.

05

Government response

Interventions and stringency from the University of Oxford, plus emergency declarations.

06

Weather

Daily meteorological readings from NOAA stations matched to each location.

07

Demographics & economy

Population, age structure, GDP, health-system capacity and geography as static covariates.

08

By age and by sex

Cases, deaths and hospitalizations broken down by age bracket and sex where available.

Data: CC BY·Code: Apache 2.0·Retrospective since Sep 15, 2022
Browse the dataset on GitHub
Published research

Peer-reviewed, twice.

The dataset itself, and the partnership model that built it.

Nature · Scientific Data · April 2022

COVID-19 Open-Data: A global-scale spatially granular meta-dataset for coronavirus disease

Oscar Wahltinez, Aurora Cheung, Ruth Alcantara, Donny Cheung, Mayank Daswani, Anthony Erlinger, Matt Lee, Pranali Yawalkar, Paula Lê, Ofir Picazo Navarro, Michael P. Brenner & Kevin Murphy

The data paper. It describes how indicators from authoritative sources around the world were combined into one open repository with consistent location keys, covering 22,000+ locations across 190+ countries, and how it was kept current throughout the pandemic.

American Journal of Health Education · 2023

The Mango Model: Best Practices in the Creation of a COVID-19 Open Data Project Through a Partnership with Google Health and the Non-Profit FinMango

Oscar Wahltinez, Scott Glasgow, Aurora Cheung, James F. Glasgow, Martin Noguera, James W. Glasgow & Pamela Neidert Hoalt

The how-we-did-it paper. A case study of the partnership between a technology company and a volunteer-run nonprofit: how the work was organized, what went wrong, and what to copy. Written as a blueprint for the next public-health data collaboration.

In the press

The volunteers

The people the letter was addressed to.

Forty-eight people who, in Google's words, gave their daily best on top of school, work and family.

Core team

Led the project from inception through completion, 2020–2022

Pam Hoalt, PhD
James Glasgow, PhD
Ojasvinee Singh, JD
James Glasgow, Pharm.D.
Rebeca Lozano
Kishan Patel
Uday Patel
Kevin D'Souza
Enrico Buoro
Martin Noguera
Erik Liang
Scott Glasgow
Bruna Chixaro
Chelsie Kindangen
Bill Maimone
Ahana Samat

Research contributors

Manual curation of regional data sources and research on the pandemic's impact on local economies

Angelica Carlos, Nathan Immel, Josh Burton, Anthony Schilt, Nicholas Lange, Corina Newsome, Kevin Doyle, Hector Garcia, Dylan Forman, Bryce Chappelear, Esha Sharma, Marc Via, PhD, Sam Holtzapple, Swetha Sukumar, Tristan Groenewold, Jon Li, Essie Francis, Anna Cava Grosso, Jared Orr, Caitlin Murphy, Alex Mitchell, Bailey Mohri, Harsha Haribhaskar, Leigh Mante, Nathan Manthei, Ishaan Dey, Antonio Machioni, Daniel Choi, Amber Wall, Azzzaam Kapadia, Tobias Abramenko, Siona Pathak

The model didn't end with the pandemic.

Open data, volunteers, rigorous publication. The same approach now powers the Financial Health Barometer, our live reading of financial stress across all 50 states.